Lots of data flows into an organization every minute. Business Intelligence (BI) plays a major role to transform these raw data into representations like graphs / reports, enabling decision makers to identify and act on its strategic and operational opportunities. BI is a technology-driven process for analyzing data and presenting actionable information to help corporate executives, business managers and other end users make more informed business decisions.
Business Intelligence suites can work well with any Enterprise Resource Planning (ERP) or data source systems ranging from excel to cloud connectors and pull data. ERP like Tally, Microsoft Dynamics, Navision, AX, GP, SAP Business One, Acumatica, Oracle or any other data source systems, we can integrate and provide you BI solution.
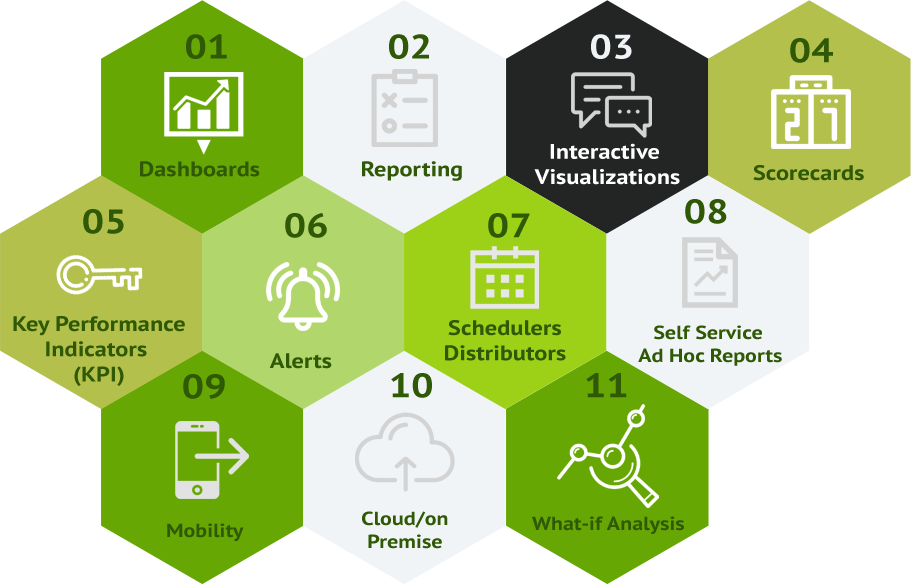
Dashboard A data visualization tool to display the broad or high-level idea of what is happening in the company. Similar to a dashboard of a car which will indicate the car status at a specific point in time.
Reporting The process of providing information or reports in summarized and structured format for the analysis or operations performed on one or more sets of data. It is generally a standard textual content.
Interactive Data Visualizations One part is data, the other part is seeing the data. Visualizations are like graphs / charts which will be easily understandable by end users. Visuals can be driven by highly interactive input selections.
Scorecards A data visualization tool that helps to reach goals by displaying progress toward objectives against the objectives themselves.
Key Performance Indicators (KPI) Is a type of performance measurement. KPIs evaluate the success of an organization. Examples: customer satisfaction, zero defects, collection of bad debts, new customer acquisition
Alerts Alerts are notifications for thresholds of a company's performance.
Schedulers / Distributors Setting up of activities to occur at repeated intervals is called scheduler. Example: inventory stock report on daily basis. Distributing the results of reports or dashboard etc., by email, file trasfer protocol (FTP) etc., to end users is called distribution. Need not login to BI system to view the results.
Self service / Ad-hoc Reports Users can create their own BI reports, they need not depend on IT team to create reports at the need of the hour. Easily and quickly by simple drag / drop options, the reports will be ready to use.
Over mobile On-the-go, anywhere and everywhere BI reports / dashboards can be accessed from hand held devices.
Cloud/On-premise Most of the BIs support its usage, either by installing in a company's server or access to it over a cloud. Based on company's requirement, one of these options can be chosen.
What-if analysis Allows the user to set custom parameters and then use those to forecast other, usually related parameters. For example, if a correlation is noticed between falling prices and increased sales, software that supports “what-if analysis” should allow you to set a particular price level and then project a ‘what-if’ scenario for sales numbers.